Documentation Index
Fetch the complete documentation index at: https://docs.roark.ai/llms.txt
Use this file to discover all available pages before exploring further.
Overview
Reports allow you to chain multiple metrics together to create comprehensive analytics dashboards. Track trends, compare performance, and drill down into specific calls - all from a single view.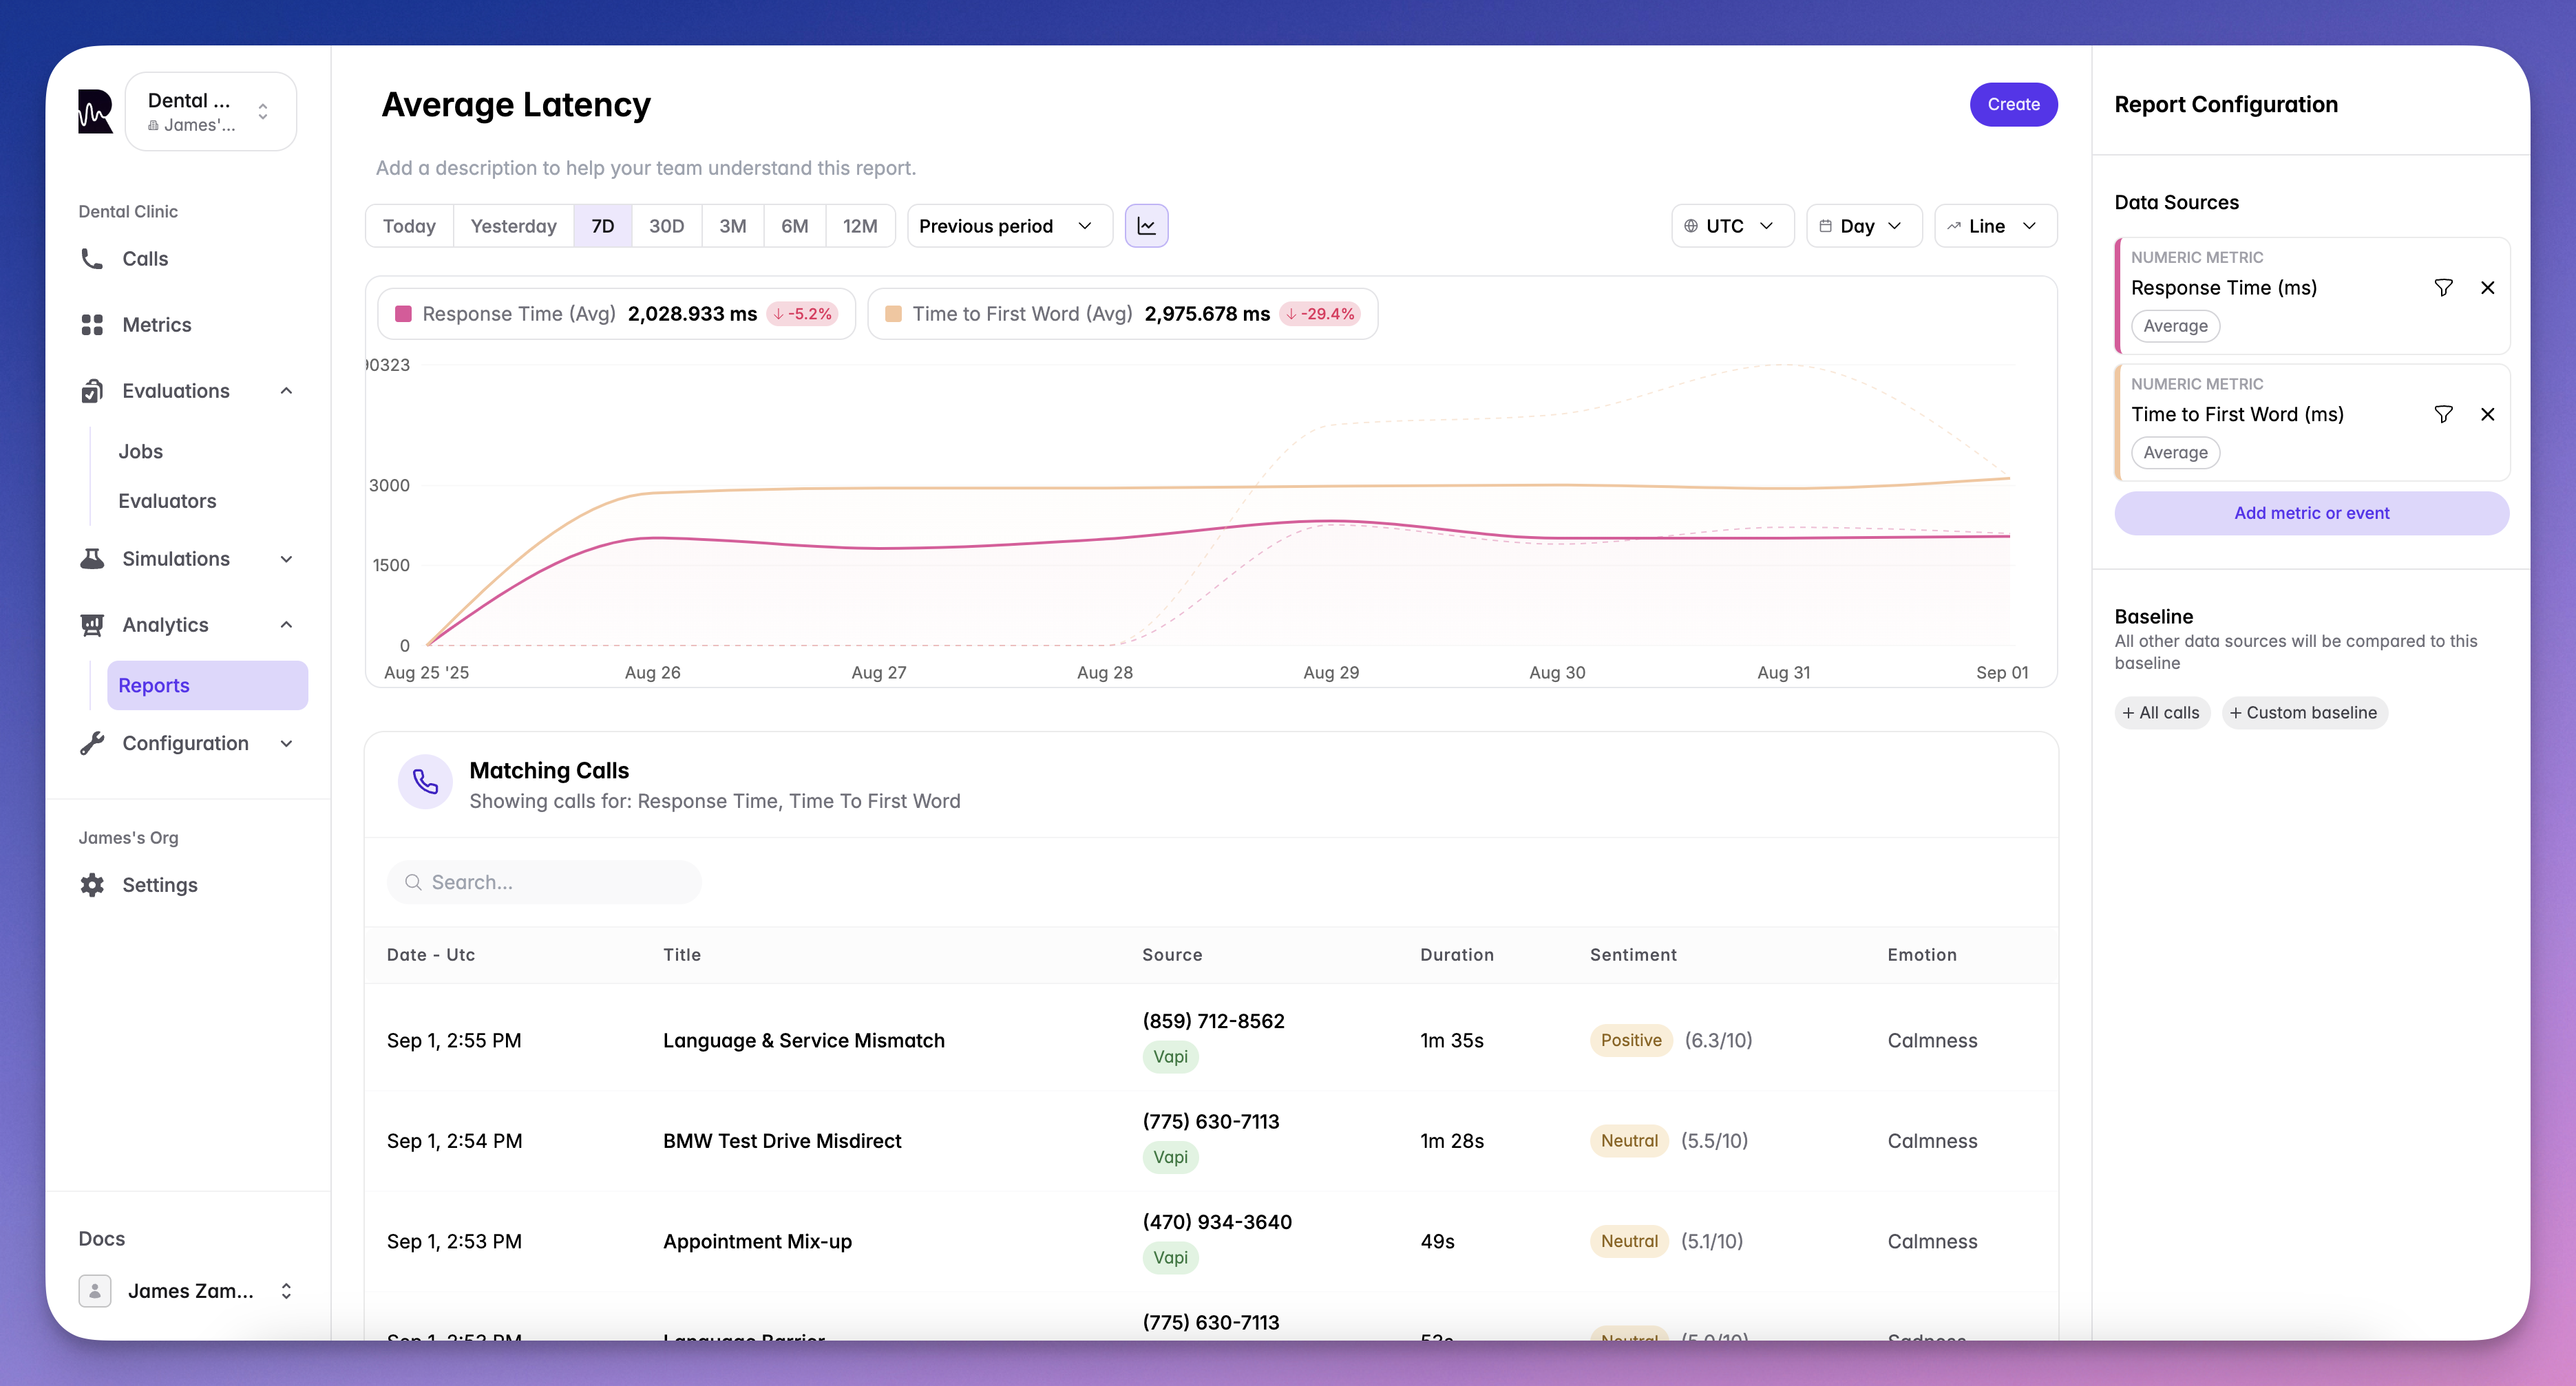
What You Can Report On
Events
Track occurrences of specific events in your system:evaluation_failed- When calls fail quality checkstask_completed- Successful objective completionescalation_triggered- Customer requested human agenttool_call_failed- Function execution errors- Custom events defined in your system
Metrics
Analyze performance indicators over time:response_time- Agent response latencysentiment_score- Customer satisfaction trendsinterruption_count- Conversation flow issuescall_duration- Efficiency metrics- Any custom metrics you’ve defined
- Count - Total number of occurrences
- Average - Mean value across calls
- Sum - Total combined value
- Minimum - Lowest recorded value
- Maximum - Highest recorded value
- Median - Middle value (50th percentile)
- P90 - 90th percentile value
- P95 - 95th percentile value
Baseline Configuration
Set context for your data with flexible baseline options:- Percentage Baseline
- Custom Baseline
- Sum Baseline
View data as a percentage against all your calls:
Visualization Options
Line Graph
Track trends over time with detailed line charts:- Identifying patterns and trends
- Comparing multiple metrics
- Spotting anomalies
Number Chart
Display key metrics as single values or comparisons: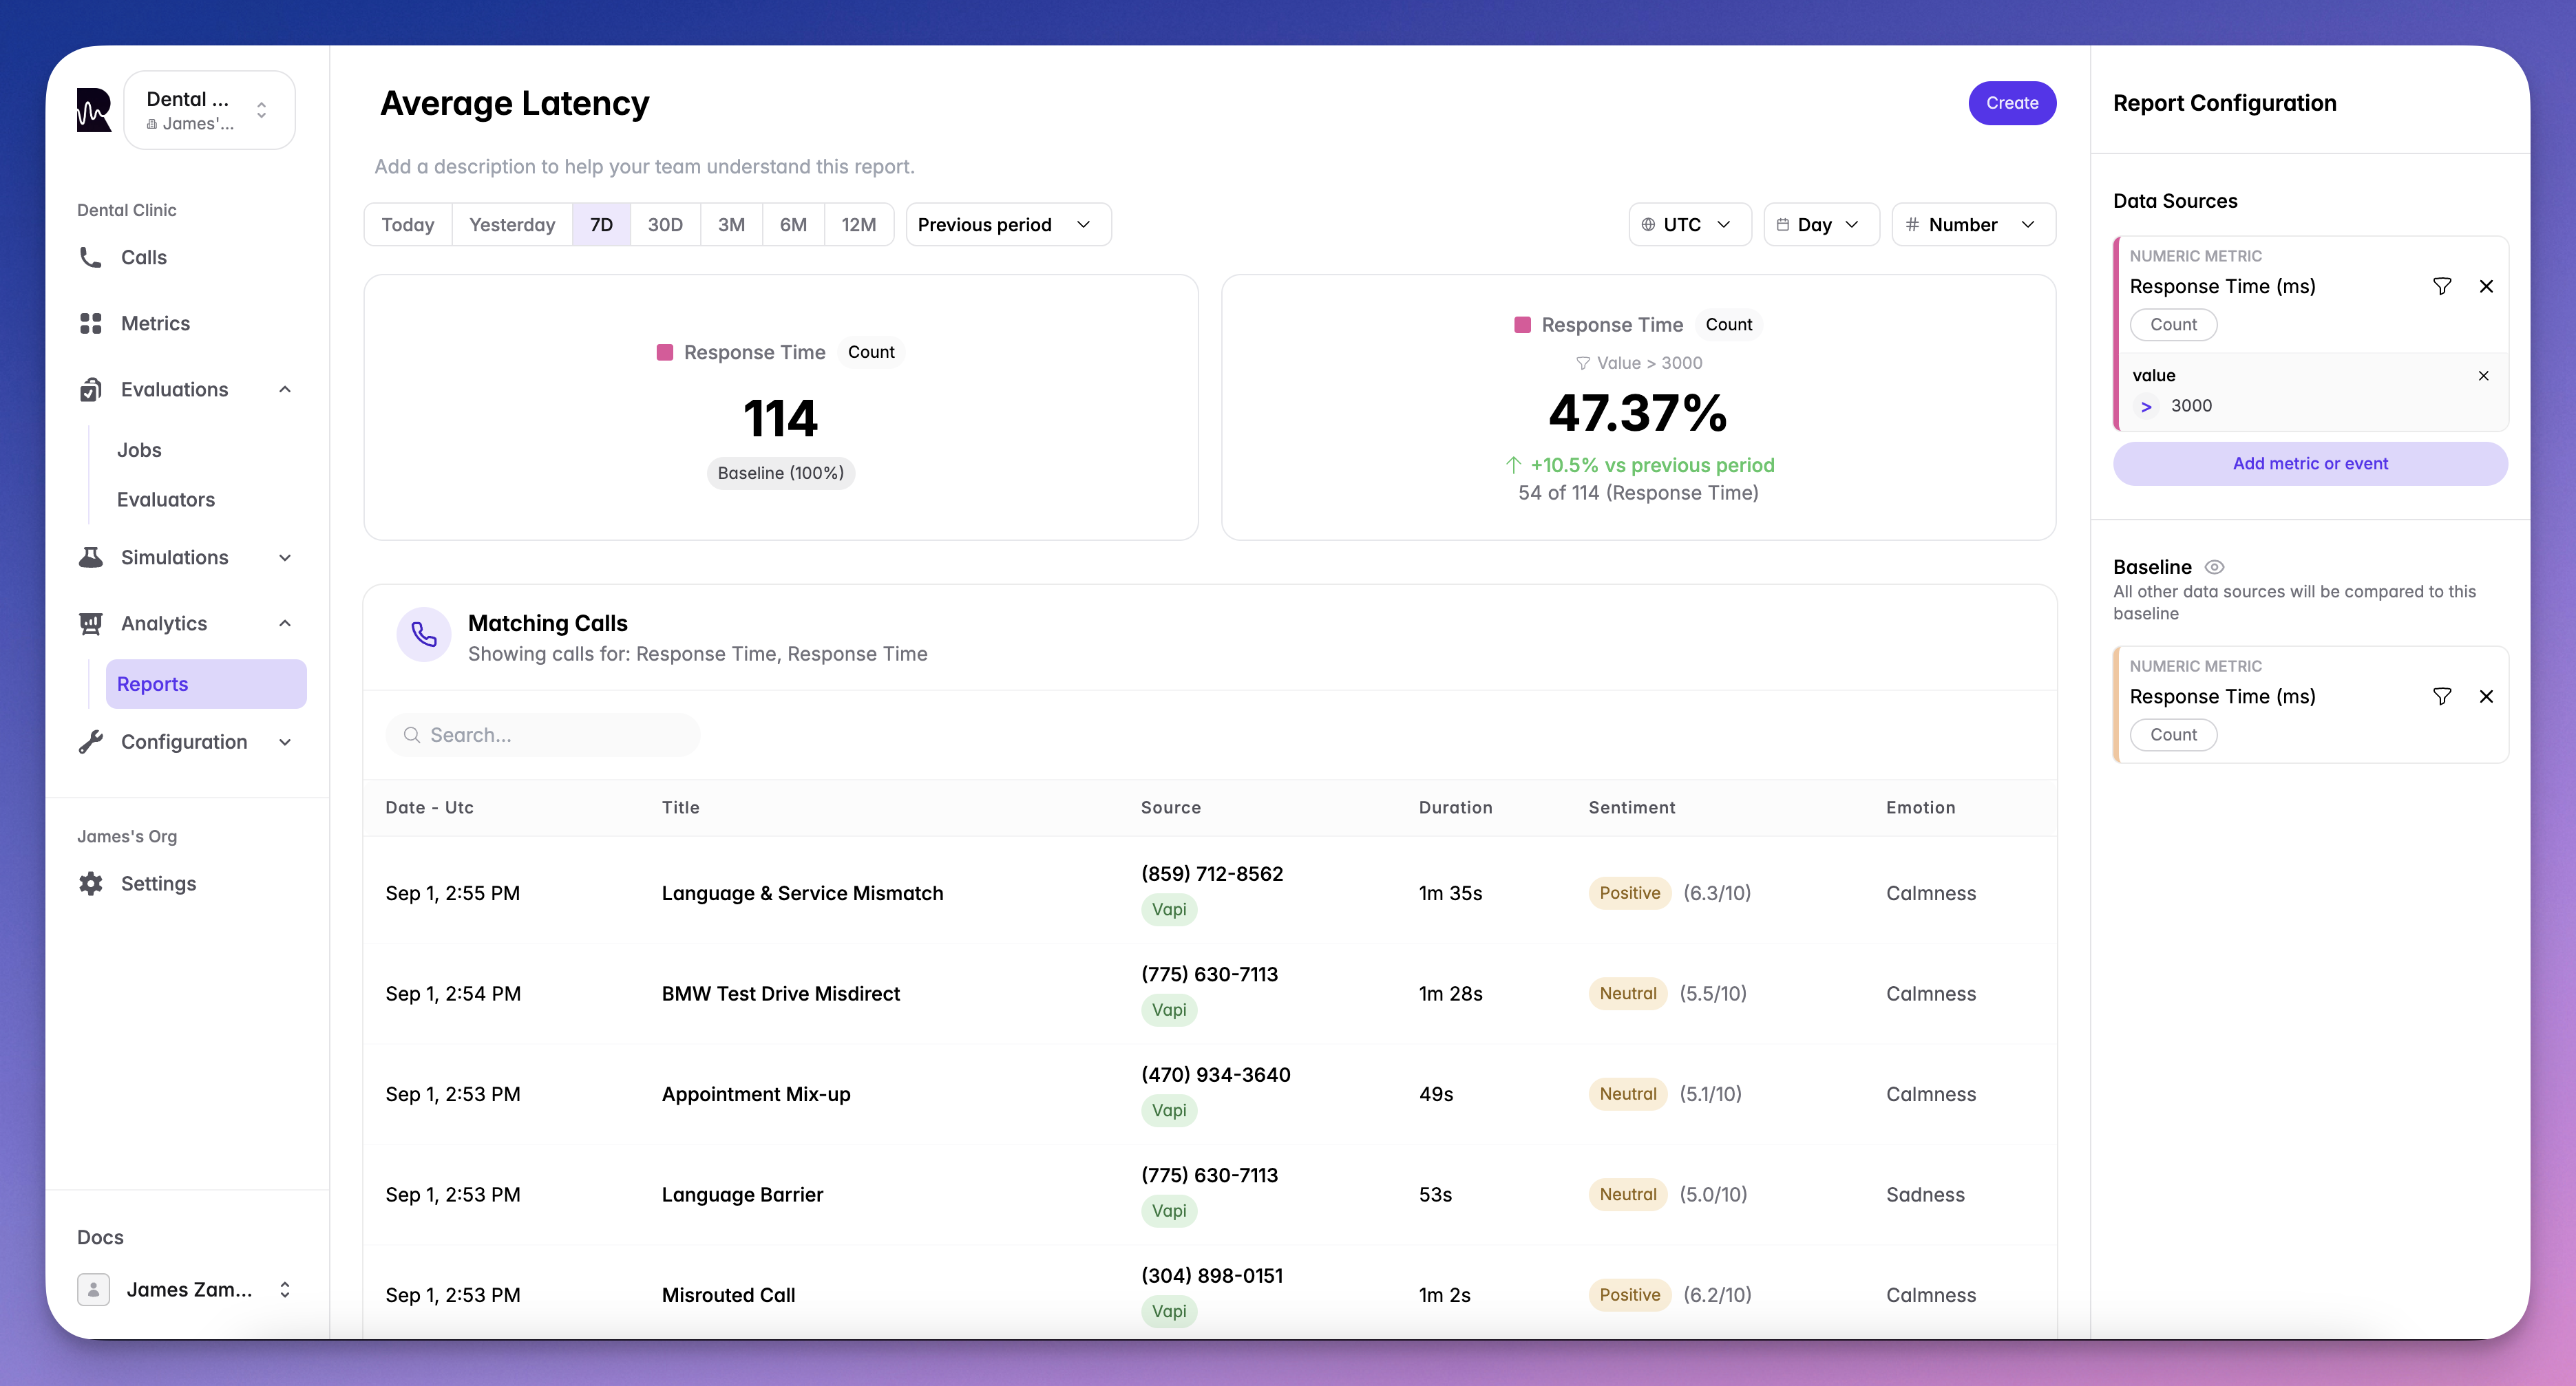
- Executive dashboards
- Quick status checks
- KPI monitoring
Time Controls
Customize your view with flexible time options:Time Period
- Last 24 hours
- Last 7 days
- Last 30 days
- Last 90 days
- Custom date range
Interval Grouping
- Hour: For real-time monitoring
- Day: For daily trends
- Week: For weekly patterns
- Month: For long-term analysis
- Year: For annual comparisons
Chain Multiple Metrics
Create powerful insights by combining metrics:Correlation Analysis
Compare response_time with customer_satisfaction to find relationships
Compound Metrics
Stack multiple metrics to see the complete picture
Event + Metric
Combine events with metrics for context (e.g., response_time when evaluation_failed)
Sequential Analysis
Track how one metric affects another over time
Drill-Down to Calls
Every data point connects to the actual conversations:- Click any data point on your report
- View matching calls that contributed to that metric
- Navigate directly to the call screen from Live Monitoring
- Analyze the conversation with full transcript and analysis
Use Cases
Performance Tracking
Monitor agent efficiency and quality:- Average response times by agent
- Task completion rates over time
- Customer satisfaction trends
Issue Detection
Identify problems before they escalate:- Spike in failed evaluations
- Increase in customer frustration
- Pattern of tool failures
Business Intelligence
Track metrics that matter to your business:- Conversion rates
- Average handle time
- Cost per successful interaction
Compliance Monitoring
Ensure adherence to standards:- Script compliance percentage
- Required disclosure rates
- Quality score distributions
What’s Next
Dashboards
Organize multiple reports into a single view
Live Monitoring
Monitor calls in real-time