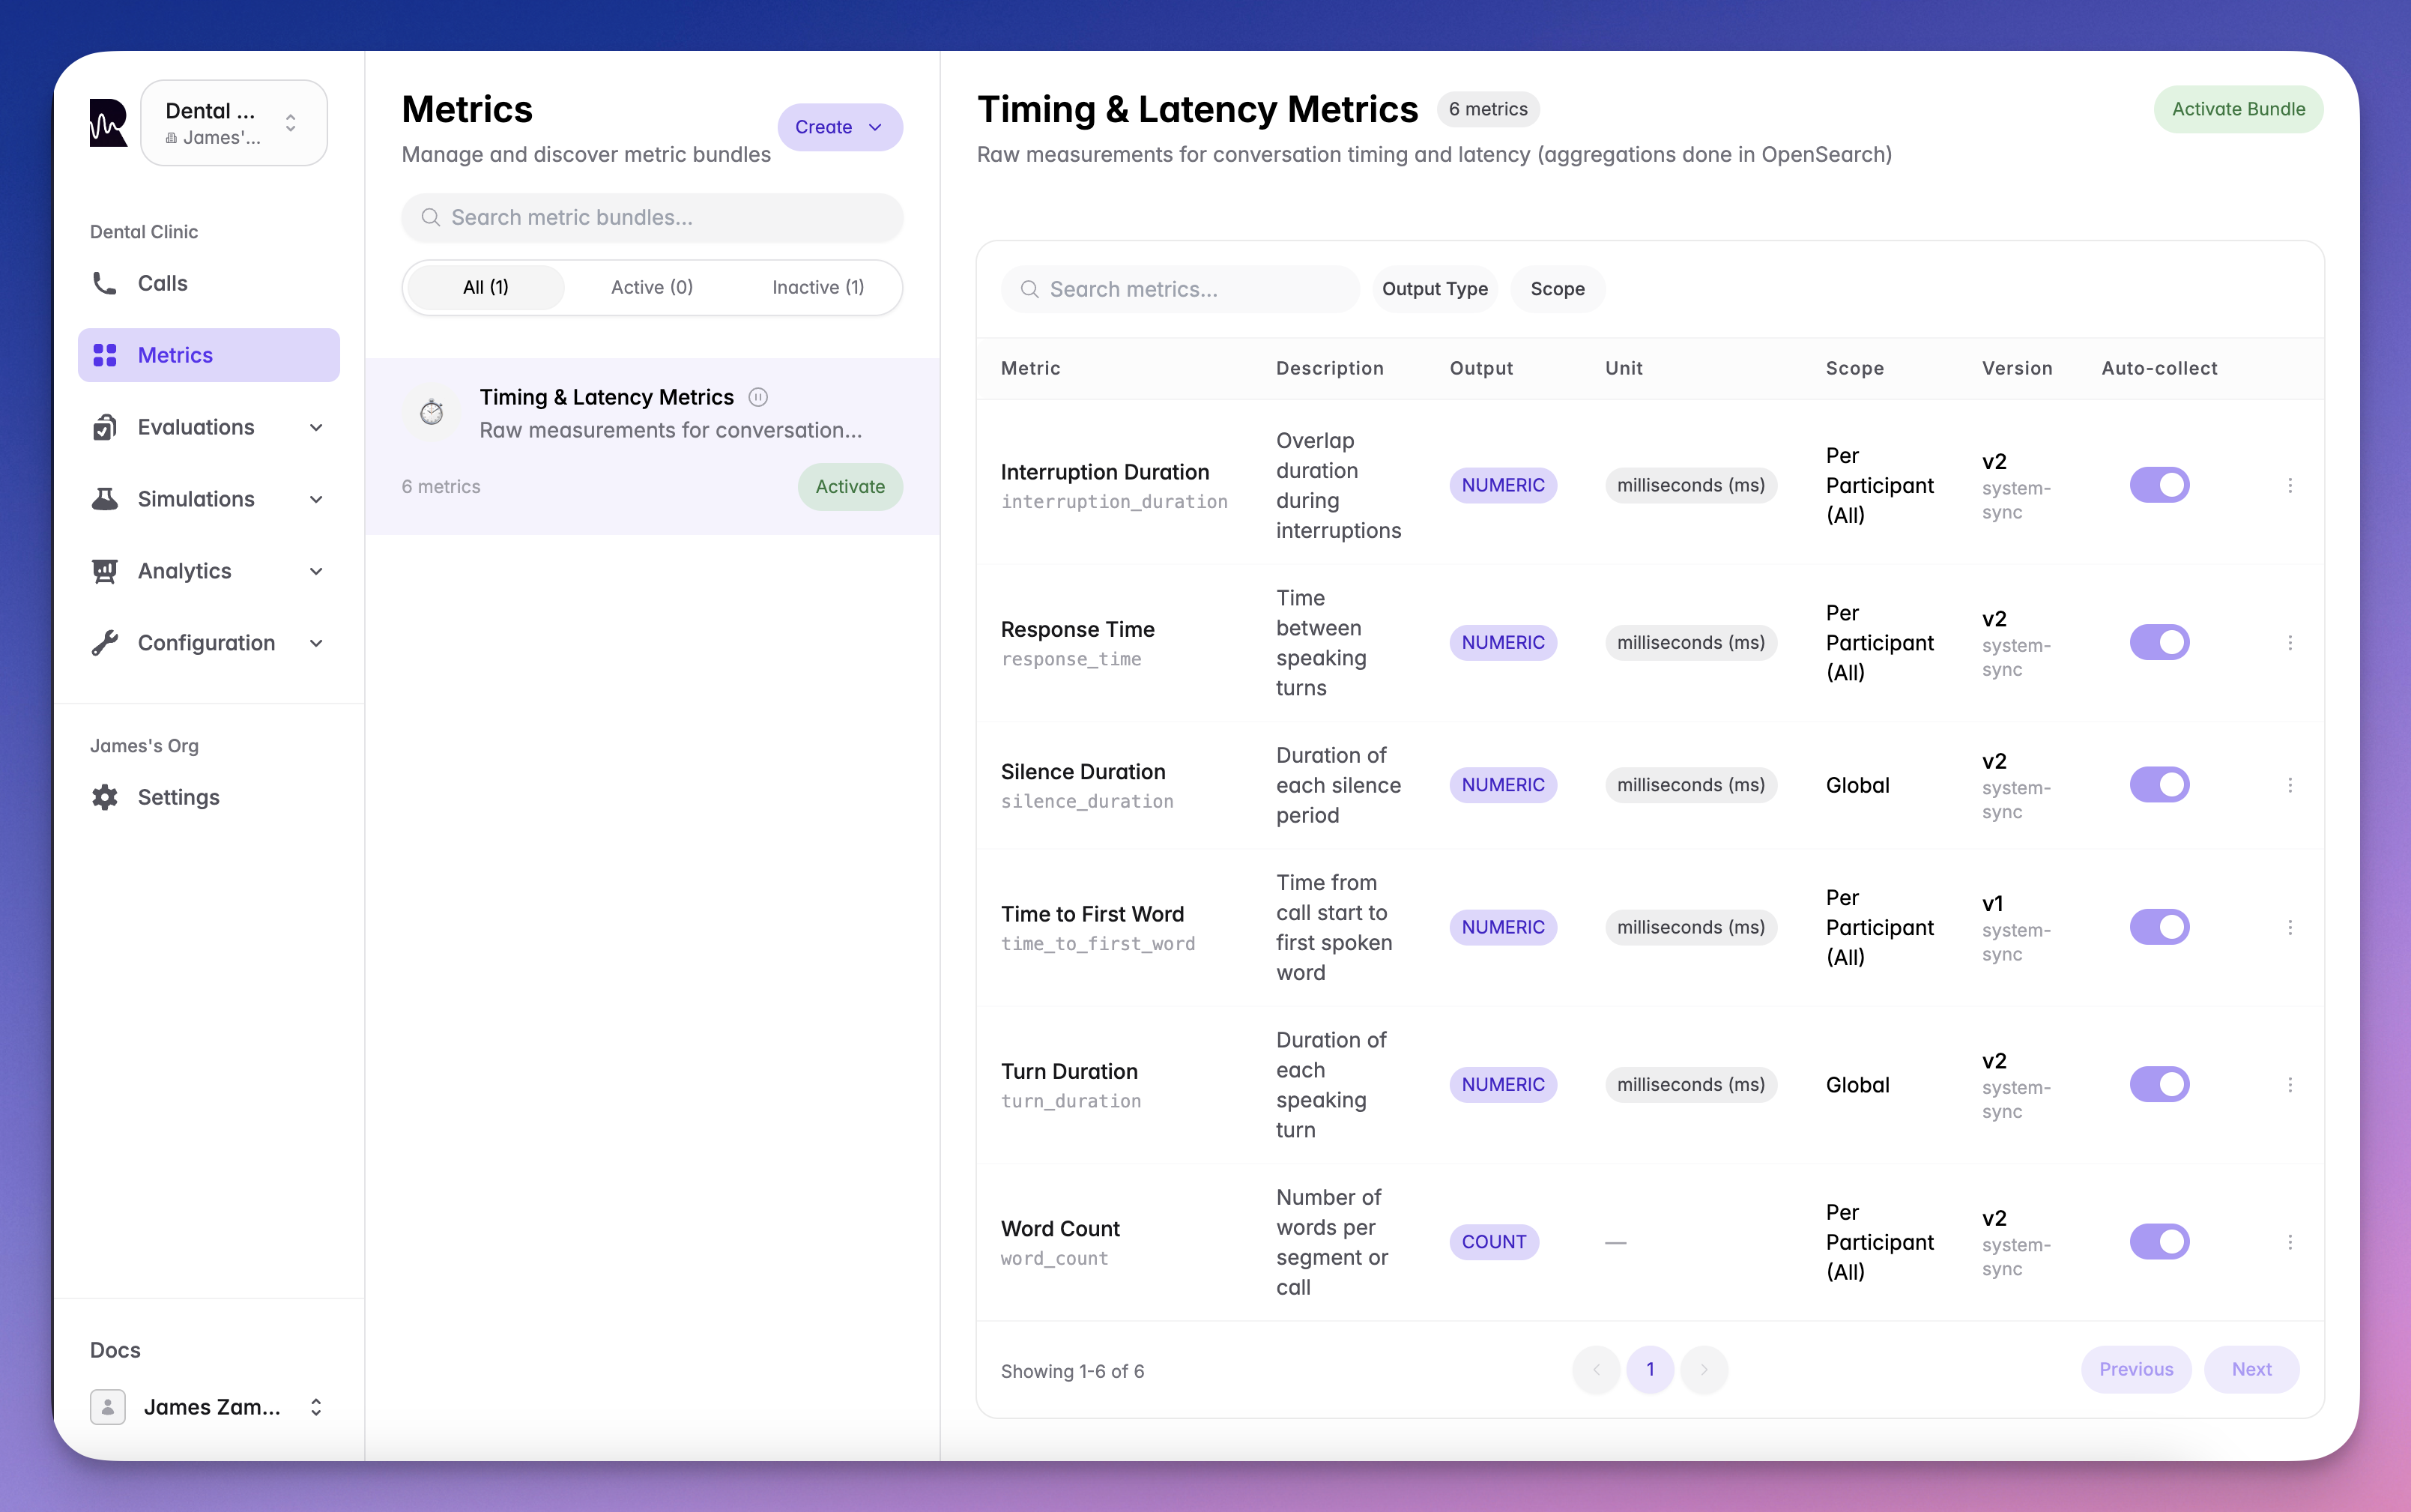
Overview
Metrics are about collecting facts and data from each call - objective measurements that help you understand what happened during conversations. From performance indicators like response_time to custom business metrics, Roark provides comprehensive data collection and analysis.
How Metrics Work
Every metric in Roark is collected at multiple levels:- Per Speaker: Track metrics for each participant (agent, customer)
- Global: Aggregate metrics across the entire call
- Filterable: Use our Reports functionality to filter and analyze what matters to you
response_time is tracked for:
- The agent’s response times
- The customer’s response times
- Overall response patterns throughout the call
Metric Contexts
Metrics can be captured at different levels of granularity:- Call-Level
- Segment-Level
- Segment Range
CALL metrics measure the entire conversation:
- Total call duration
- Overall sentiment trend
- Aggregate word counts
- Call-wide compliance checks
Metric Scopes
Metrics can have different scopes depending on what they measure:- GLOBAL: Single value for the entire call (e.g., total call duration, overall sentiment)
- PER_PARTICIPANT: Separate values for each speaker (e.g., agent talk time vs customer talk time)
Metric Output Types
Different types of data that metrics can produce:COUNT
Integer counts (e.g., number of questions asked: 5)
NUMERIC
Decimal numbers (e.g., average sentiment: 7.3)
BOOLEAN
True/false values (e.g., compliance check passed: true)
SCALE
Ratings on a scale (e.g., satisfaction score: 8 out of 10)
TEXT
Text responses (e.g., primary concern: “billing issue”)
CLASSIFICATION
Categorical labels (e.g., call outcome: “resolved”, “escalated”, “pending”)
OFFSET
Time offsets in milliseconds (e.g., first response at: 2500ms)
Metric Categories
Performance Metrics (Deterministic)
Fully deterministic calculations based on call data:- Response Time: How quickly each party responds
- Talk Time: Speaking duration per participant
- Silence Duration: Gaps and pauses in conversation
- Overlap/Interruptions: When speakers talk over each other
- Latency: Technical performance indicators
Emotion & Sentiment (Voice Analysis Models)
Powered by specialized voice analysis models:- Sentiment Tracking: Positive, negative, neutral trends
- Emotion Detection: 64+ emotions identified
- Vocal Cues: Tone changes, raised voice, sighs
- Stress Indicators: Frustration, confusion, anger
Business Metrics (LLM-Powered)
Custom metrics powered by large language models:- Task completion indicators
- Compliance checking
- Quality scoring
- Custom business KPIs
Metrics Marketplace
Enable pre-built metrics from our marketplace:Customer Service
First call resolution, escalation rate, satisfaction
Sales
Conversion rate, objection handling, upsell success
Technical Support
Issue resolution, troubleshooting efficiency, accuracy
Healthcare
HIPAA compliance, empathy scoring, appointment booking
Custom Metrics
Define your own metrics tailored to your business needs:Creating Custom Metrics
Custom Metric Configuration
1
Define the Metric
Name your metric and describe what it measures
2
Set Collection Rules
Specify when and how to collect the metric (per speaker, global, or both)
3
Configure Analysis Prompt
Define the LLM prompt or calculation method
4
Test & Deploy
Test on sample calls before enabling globally
Metric Types & Processing
- Deterministic
- Voice Analysis
- LLM-Powered
Performance metrics are calculated using exact formulas:No AI involved, 100% consistent results
Using Metrics Data
Real-Time Monitoring
- View metrics as calls happen
- Set alerts for threshold breaches
- Track performance against targets
Historical Analysis
- Trend analysis over time
- Compare agent performance
- Identify patterns and outliers
Reporting & Export
Access metric data through:- Reports Dashboard for visual analytics
- API endpoints for programmatic access
- CSV exports for external analysis
API Access
All API endpoints require authentication. Generate an API key to get started.
Get Call Metrics
Retrieve all metrics for a specific call:flatten(optional): Set totrueto return a flat list instead of grouped by metric definition. Default:false
?flatten=true):
Get Metric Definitions
Retrieve all available metric definitions for your project:Understanding Metric Values
Confidence Scores:- All metrics include a
confidencefield (0-1) - Deterministic metrics (like word count, duration) have confidence = 1.0
- AI-powered metrics include the model’s confidence level
- For AI-computed metrics, the
valueReasoningfield provides explanation - Useful for understanding why a metric was scored a certain way
- Example: “The agent verified identity using two-factor authentication as mentioned in segment 3”
- When
contextisSEGMENT, thesegmentfield contains the specific utterance - When
contextisSEGMENT_RANGE, bothfromSegmentandtoSegmentare included - All segment objects include the full text and timing information
Best Practices
Start with Core Metrics
Start with Core Metrics
Enable essential metrics first, then gradually add custom ones based on specific needs
Balance Coverage
Balance Coverage
Track both agent and customer metrics for complete conversation understanding
Validate Custom Metrics
Validate Custom Metrics
Test custom metrics on representative call samples before full deployment

